
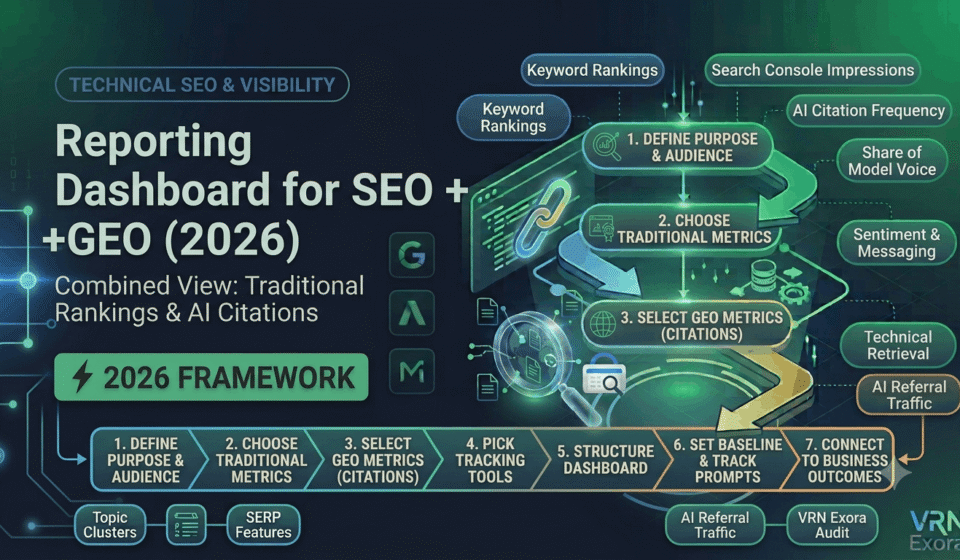

A combined SEO and GEO reporting dashboard tracks both how your site performs in traditional Google rankings and how your brand shows up inside AI-generated answers from ChatGPT, Perplexity, Gemini, and Google’s AI Overviews, in one place. This guide is for SEO managers, marketers, and agency teams who are still reporting on rankings and traffic alone and need a structure for adding AI visibility without throwing out what already works. You will learn which traditional metrics still matter, which new GEO metrics to add, how to pick the right tools for each layer, and how to organize it all into a dashboard that actually gets read.
Why SEO Dashboards Alone No Longer Tell the Full Story
A brand can hold the top ranking for a keyword and still receive zero clicks because an AI Overview answered the query above it. The same brand can have no meaningful traditional ranking for a query and still receive real referral traffic because Perplexity or Gemini cited it directly in a generated answer. A dashboard built only around rankings, impressions, and click-through rate will miss both situations entirely, which means teams relying on it are making decisions with an incomplete picture of their actual search visibility.
This does not mean traditional SEO reporting is obsolete. Search Console impressions, keyword rankings, and organic traffic from GA4 remain genuinely useful for technical health, content gap analysis, and competitive research. GEO measurement builds on top of that foundation rather than replacing it, which is why the right approach is one combined dashboard, not two separate reports that nobody reads together.
Step 1: Decide What the Dashboard Needs to Prove
Before choosing a single metric, define who reads this dashboard and what decision it needs to support. An executive dashboard needs to connect visibility metrics to revenue outcomes and competitive positioning. A content team’s working dashboard needs prompt-level detail on where coverage is weak so they know exactly what to write next. Building one dashboard trying to serve both audiences at once usually satisfies neither.
There is no single universal GEO dashboard that fits every business. A publisher cares most about citation frequency and source inclusion. A B2B software company cares more about category and comparison prompts. An ecommerce brand cares more about product recommendation prompts and sentiment. Choose the metrics that match how your specific buyers actually use AI search, rather than copying a generic template.
Step 2: Keep Your Core Traditional SEO Metrics
The foundational SEO metrics still belong on the dashboard, but a few of them now need to be read differently than they were a few years ago. Keep tracking:
- Keyword rankings, pulled from your rank tracker or Search Console average position
- Impressions and click-through rate by query, from Search Console
- Organic sessions and conversions, from GA4
- Technical health signals such as crawl errors, indexation status, and Core Web Vitals
- Backlink growth and referring domains
The key shift is context. A page ranking well with declining click-through rate is no longer automatically a title tag problem, since it may simply mean an AI Overview is now answering that query directly above the organic results. Pair each traditional metric with the GEO metrics below before drawing a conclusion from it in isolation.
Step 3: Choose Your Core GEO Metrics
GEO metrics generally fall into four categories: visibility, understanding, technical retrieval, and business outcomes. Start with a small, focused set rather than trying to track everything at once, since most teams find AI citation frequency the easiest and most concrete starting point.
| Category | Metric | What it tells you |
|---|---|---|
| Visibility | AI citation frequency | How often your brand or content is referenced in AI-generated answers |
| Visibility | Answer inclusion rate | The percentage of relevant prompts where your brand appears at all |
| Visibility | Share of Model Voice | Your visibility relative to named competitors across the same prompt set |
| Visibility | Prompt coverage | How many of your core topics and buyer questions you actually appear for |
| Understanding | Sentiment and message consistency | Whether AI systems describe your brand accurately and favorably |
| Technical | Content retrieval success and schema coverage | Whether AI crawlers can access and correctly parse your content |
| Outcomes | AI referral traffic and assisted conversions | Whether AI visibility is translating into real business results |
Start with five to ten core topics you want AI systems to associate with your brand, then map realistic prompts across the buyer journey for each one, mixing awareness-stage questions with direct comparison and recommendation prompts. Testing only branded queries will miss most of where real discovery actually happens, since buyers ask nuanced, conversational questions by use case and problem rather than searching your brand name directly. This is why LLM optimization and AI visibility measurement are becoming increasingly important.
Step 4: Pick Your Tracking Tools for Each Layer
No single tool currently covers both traditional SEO and GEO reporting equally well, so most dashboards pull from at least two sources. For traditional SEO, Google Search Console and GA4 remain the free, authoritative baseline, supplemented by a paid tool like Ahrefs or Semrush for keyword and backlink data.
For GEO specifically, dedicated AI visibility platforms have matured quickly. Options in active use as of 2026 include Semrush’s AI Toolkit and Ahrefs’ Brand Radar for teams already inside those ecosystems, and standalone GEO platforms such as Profound, Otterly.AI, Peec AI, and Scrunch AI for more focused AI citation tracking across ChatGPT, Perplexity, and Google AI Overviews. Otterly.AI is commonly cited as a simpler entry point for freelancers and small teams, while more enterprise-oriented platforms offer deeper competitive benchmarking and API access for pulling data directly into your own dashboard.
Whichever tool you choose, confirm it covers the specific AI platforms your buyers actually use and check its data refresh cycle, since some GEO tools currently update weekly rather than daily, which affects how quickly the dashboard reflects real change.
Step 5: Structure the Dashboard Into Clear Sections
Organize the dashboard into distinct sections rather than mixing traditional and GEO metrics into one undifferentiated wall of charts. A workable structure is:
- Traditional search health: rankings, impressions, CTR, organic traffic, and technical status in one section
- AI visibility: citation frequency, share of voice, and prompt coverage trends by platform in a second section
- Competitive positioning: your visibility against named competitors across the same prompt set
- Business impact: AI referral traffic, assisted conversions, and any branded search lift tied back to AI mentions
Present GEO results alongside the traditional metrics rather than in a completely separate report, since the goal is one coherent picture of search visibility, not two disconnected narratives that leadership has to reconcile themselves.
Step 6: Set a Baseline and Track Prompt-Level Coverage
Before drawing any conclusions from month-to-month movement, run an initial baseline pass across your full prompt set and record where your brand currently appears, where a competitor appears instead, and where neither shows up at all. This baseline is what every future GEO number in the dashboard gets compared against.
Keep a prompt-level view available underneath the summary dashboard, not just the aggregate score. An aggregate citation rate can stay flat while individual prompts shift significantly in opposite directions, and the prompt-level detail is what actually tells a content team what to fix or expand next.
Step 7: Connect GEO Metrics to Business Outcomes
Citation frequency and share of voice are useful directional signals, but they mean little to leadership on their own without a link back to revenue. Track AI referral traffic as a distinct segment inside GA4 where possible, and monitor assisted conversions from that traffic alongside any noticeable lift in branded search volume following a period of stronger AI citation activity.
Be transparent that this attribution is directional rather than exact. Most teams work with pattern-level signals here, since a user who discovers a brand through an AI answer often converts later through a different, harder-to-trace path, similar to how offline brand awareness has always been difficult to attribute with precision.
How Often to Review and Update the Dashboard
Review the full dashboard monthly, and treat any sudden drop in citation rate as worth investigating immediately rather than waiting for the next cycle, since a sharp decline often signals a competitor content change, an underlying AI model update, or a genuine shift in how a prompt is being asked. Revisit your core prompt set and tracked topics quarterly, since buyer language and the questions people ask AI assistants evolve faster than traditional keyword research cycles typically account for.
Treat the dashboard itself as a living document rather than a fixed template. As AI search platforms add new features, such as Google’s AI Mode or expanded shopping integrations, expect to add new tracked surfaces to the dashboard over time rather than assuming today’s structure will still be complete a year from now.
Frequently Asked Questions
What is the single most important GEO metric to start with?
AI citation frequency is generally the easiest starting point because it is simple, concrete, and directly answers whether AI systems are referencing your brand at all before you move on to more nuanced metrics like share of voice or sentiment.
Do I need a separate dashboard for GEO, or can I add it to my existing SEO dashboard?
One combined dashboard is the better approach for most teams. Presenting GEO results alongside traditional SEO metrics gives a complete search visibility picture, while two separate reports tend to get reconciled inconsistently or simply not read together at all.
Can Google Search Console show me AI Overview performance directly?
Not fully yet for most properties. Search Console is still primarily built around traditional web search clicks and impressions, which is why dedicated GEO tracking tools have emerged specifically to fill that measurement gap.
How do I know if a drop in citation rate is a real problem?
Compare it against your baseline and check whether it is isolated to one prompt or platform versus a broad decline across your whole tracked set. An isolated drop often points to a specific competitor gaining ground on that topic, while a broad decline is more likely tied to an AI model update worth investigating further.
Which AI platforms should a GEO dashboard actually track?
At minimum, track ChatGPT, Perplexity, and Google’s AI Overviews, since these currently have the broadest usage. Add Gemini, Copilot, and Google’s AI Mode where your tool supports it, prioritizing whichever platforms your specific buyers are most likely to use based on your industry and audience.
Is GEO reporting only relevant for large enterprise brands?
No. Simpler, lower-cost GEO tracking tools exist specifically for smaller teams, freelancers, and agencies who need directional AI visibility data without an enterprise-level platform or budget.
Get a Free Expert Review of Your Search Visibility
Building a dashboard that actually connects traditional rankings to AI search visibility takes the right structure from day one. If you want a faster starting point, get a free SEO audit from VRN Exora and see exactly where your current search and AI visibility stand before you build your reporting stack.